GetFeedback
Creating Salesforce Reports and Dashboards
Once you've built your GetFeedback Custom Mappings and created your email template with Salesforce merge fields, you can use survey responses to build custom reports and dashboards in Salesforce.
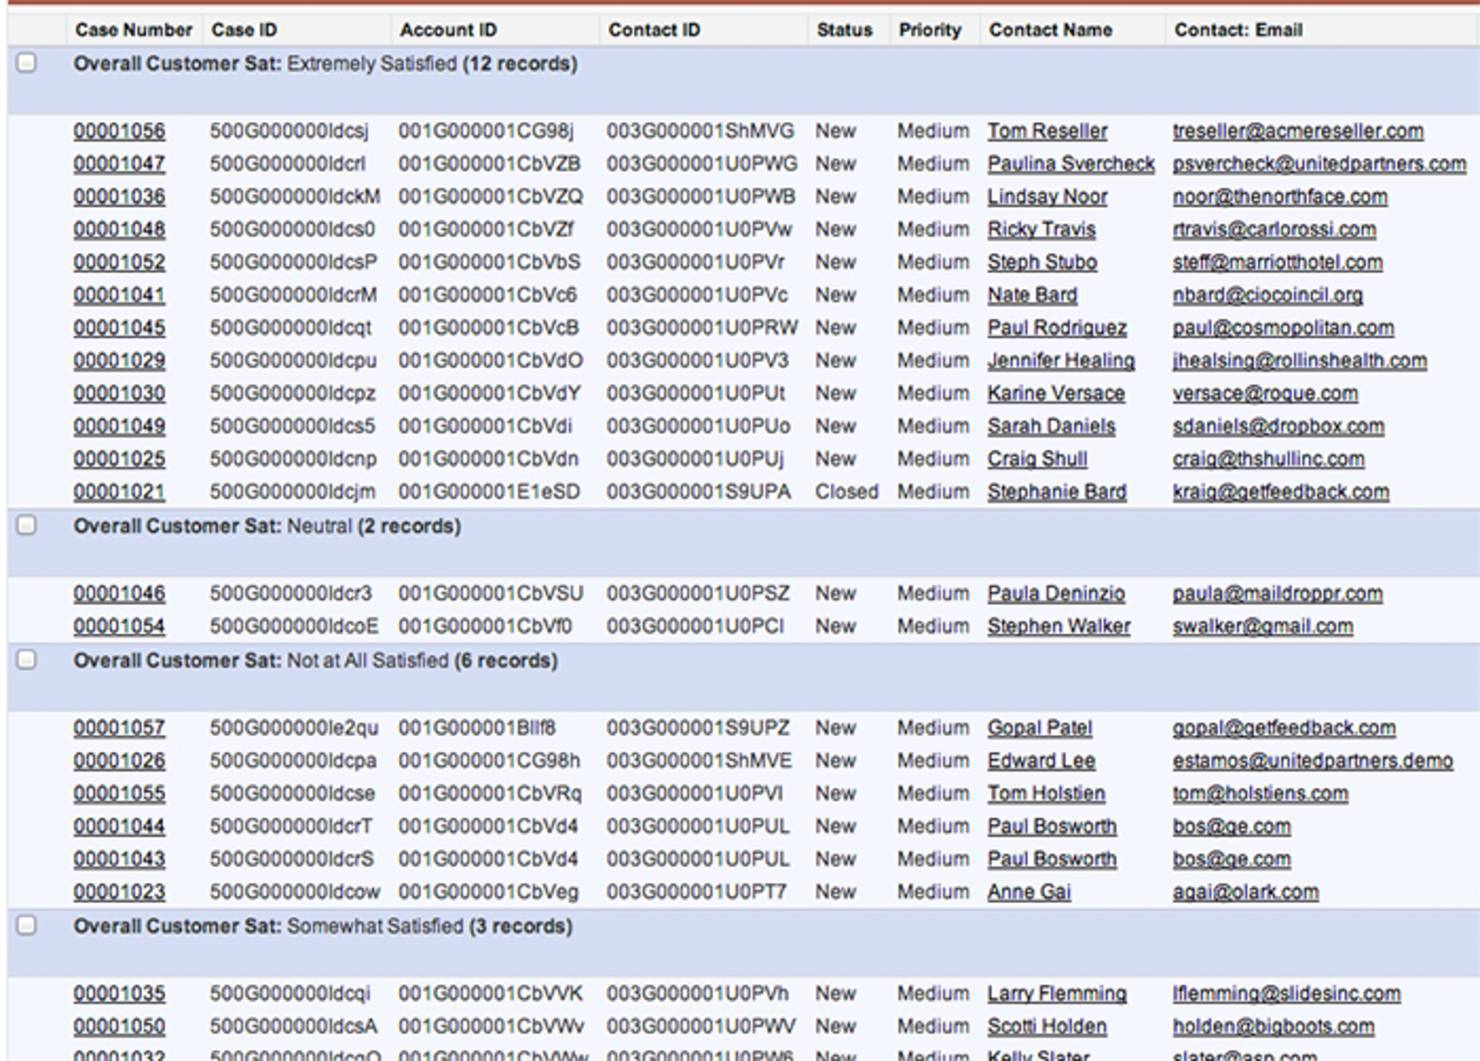
In this example, we have mapped an Overall Customer Satisfaction field into our Contact and Account records. Now we can build a report that groups customer satisfaction (CSAT) responses by score.
Using Salesforce Dashboards
There are many ways to report on survey response data within Salesforce. Once you’ve created reports, you can create Salesforce Dashboards based on those reports. The image below shows a Customer Satisfaction dashboard based on custom Net Promoter Score and Customer Satisfaction reports:
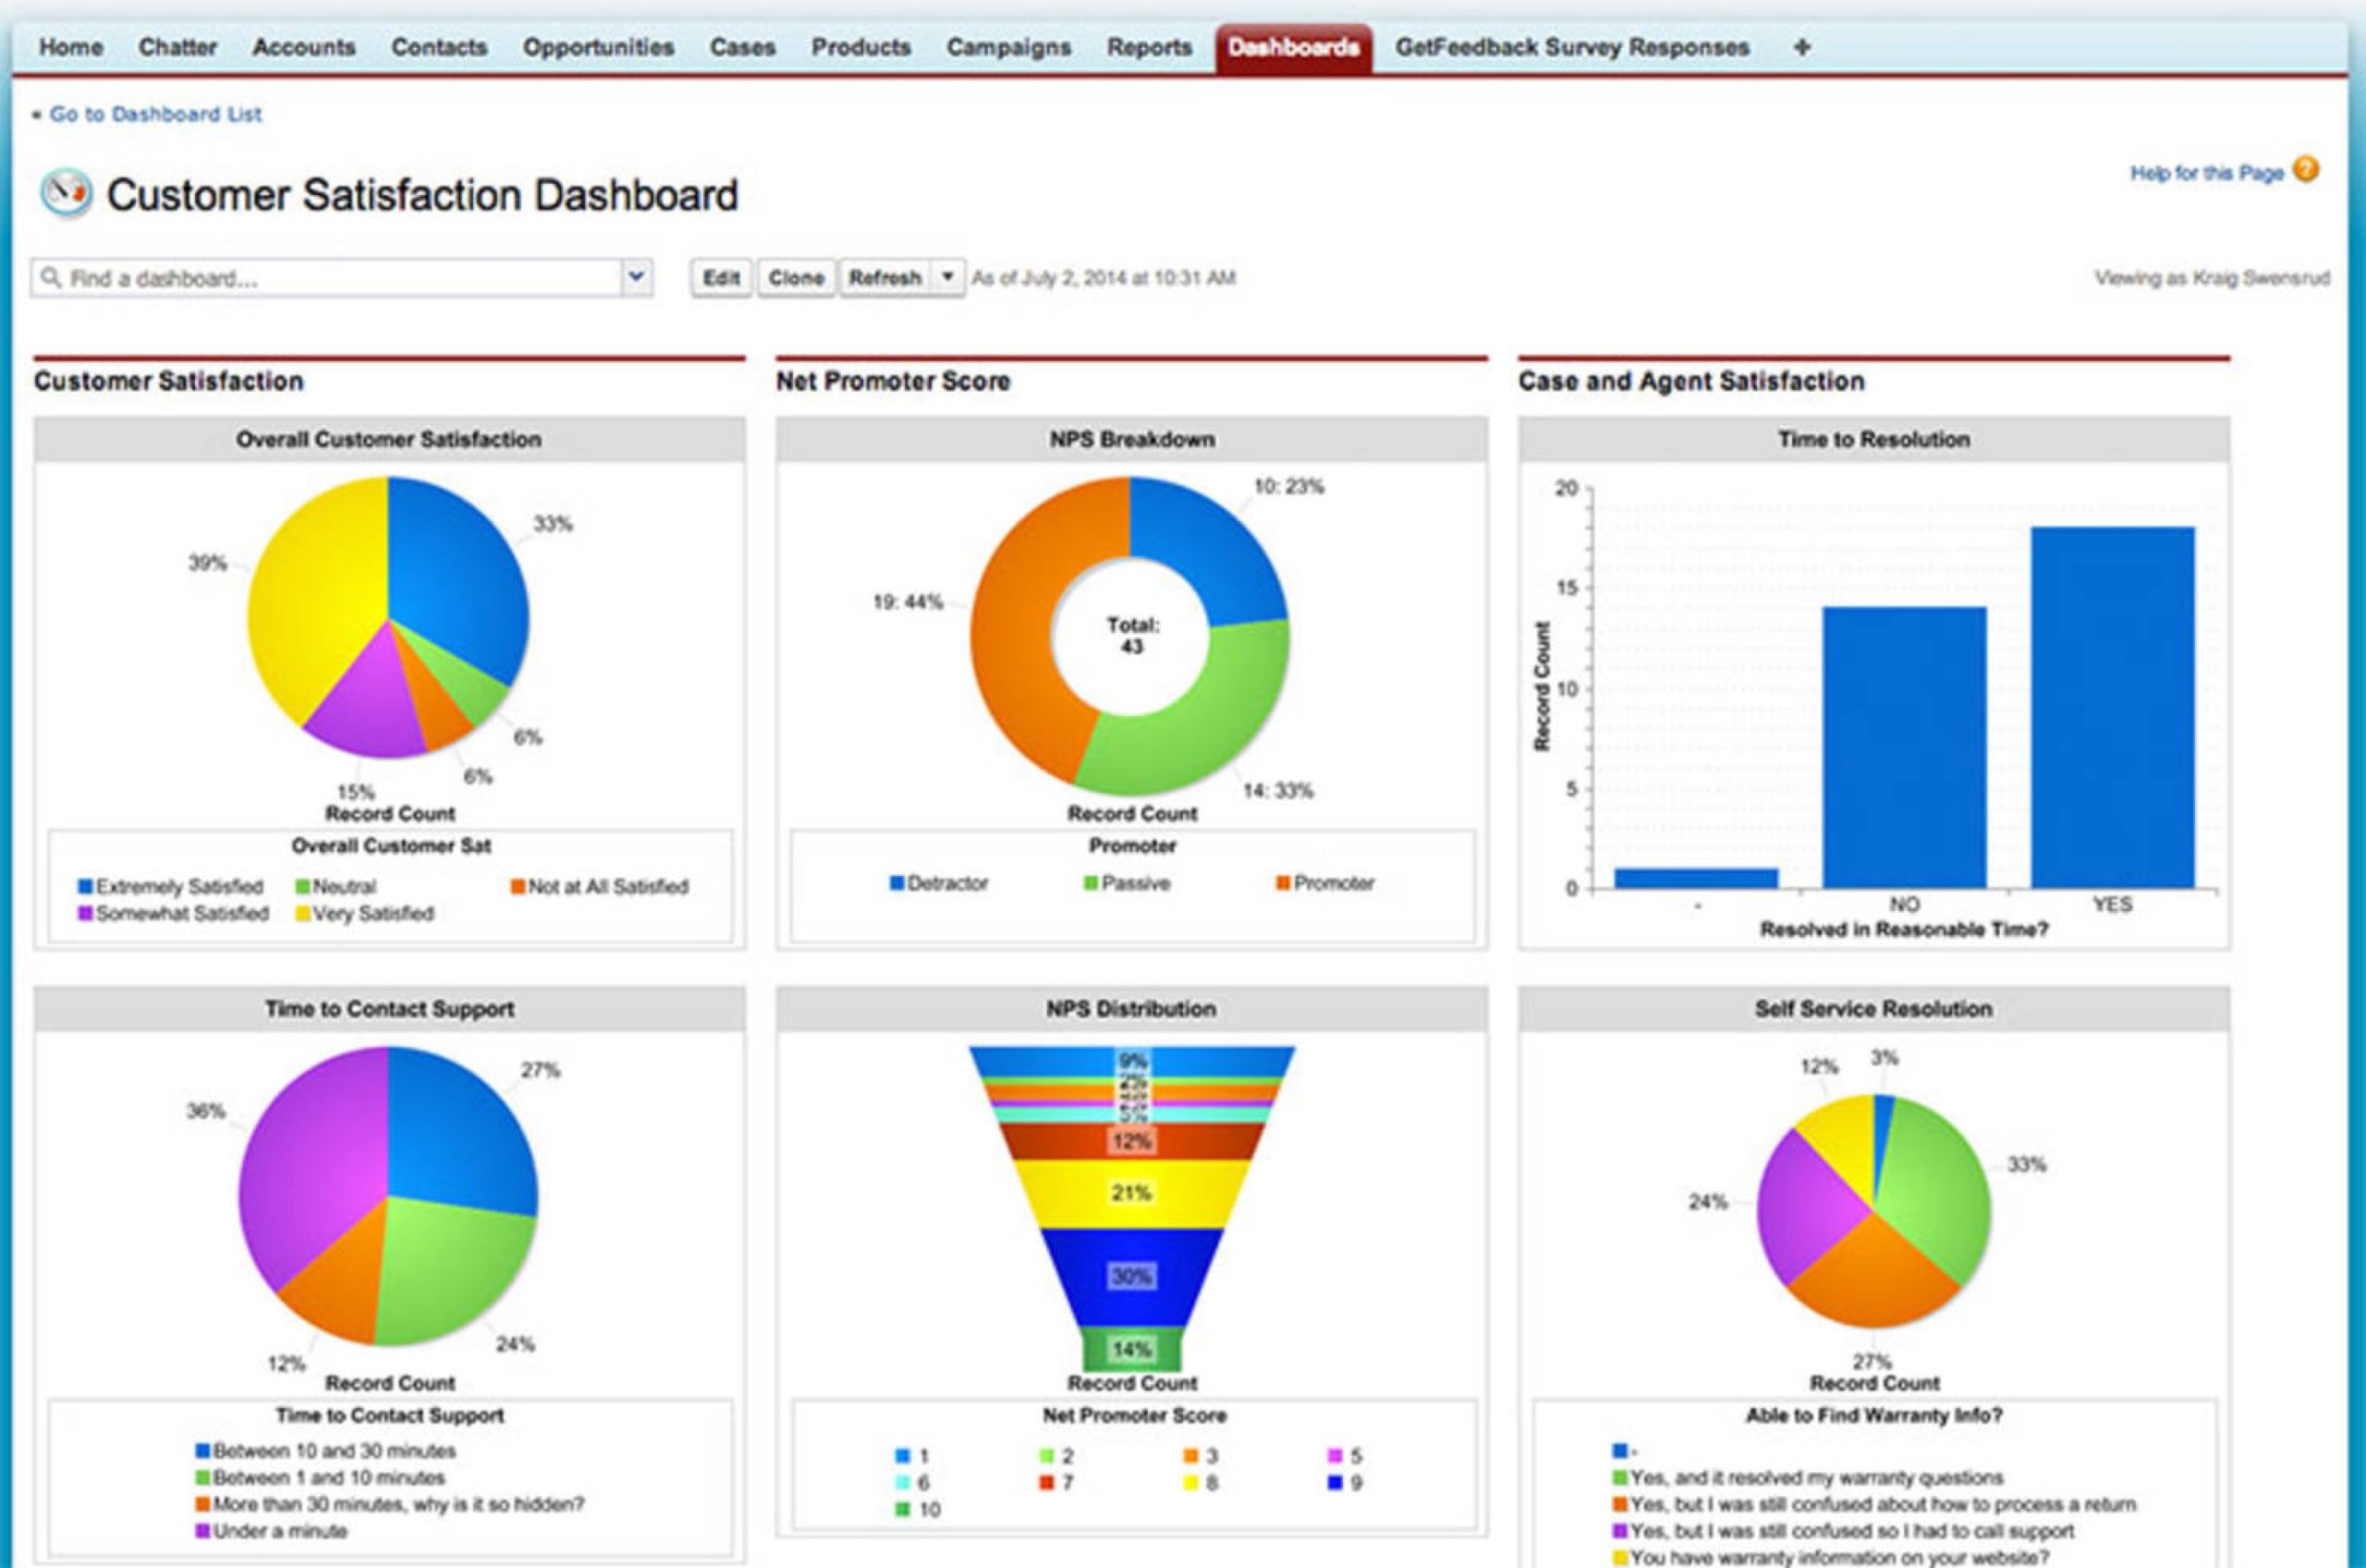
You can edit, delete, and add new Reports and Dashboards within Salesforce as needed.
Applying Formulas to Data
You can also use formula fields to categorize your data. For example, if you map Net Promoter Score (NPS) to Salesforce, you can create a formula to categorize scores as promoter, passive, or detractor. To do this:
- Add a formula field to the object you map NPS data to.
- Create a formula that categorizes the NPS scores:
- Score of 9 or 10 is categorized as Promoter
- Score of 7 or 8 is categorized as Passive
- Score of 6 or less is categorized as Detractor
The custom formula field on your object will translate the numerical score into a NPS category. You can then use the NPS data to create a report or dashboard that groups responses by Promoter, Detractor, or Passive categories.
Sample NPS Formula
Here's an example of a formula used to determine the value of a custom field Net Promoter Score.

You can create custom reports or dashboards based on the formulas and data you created.
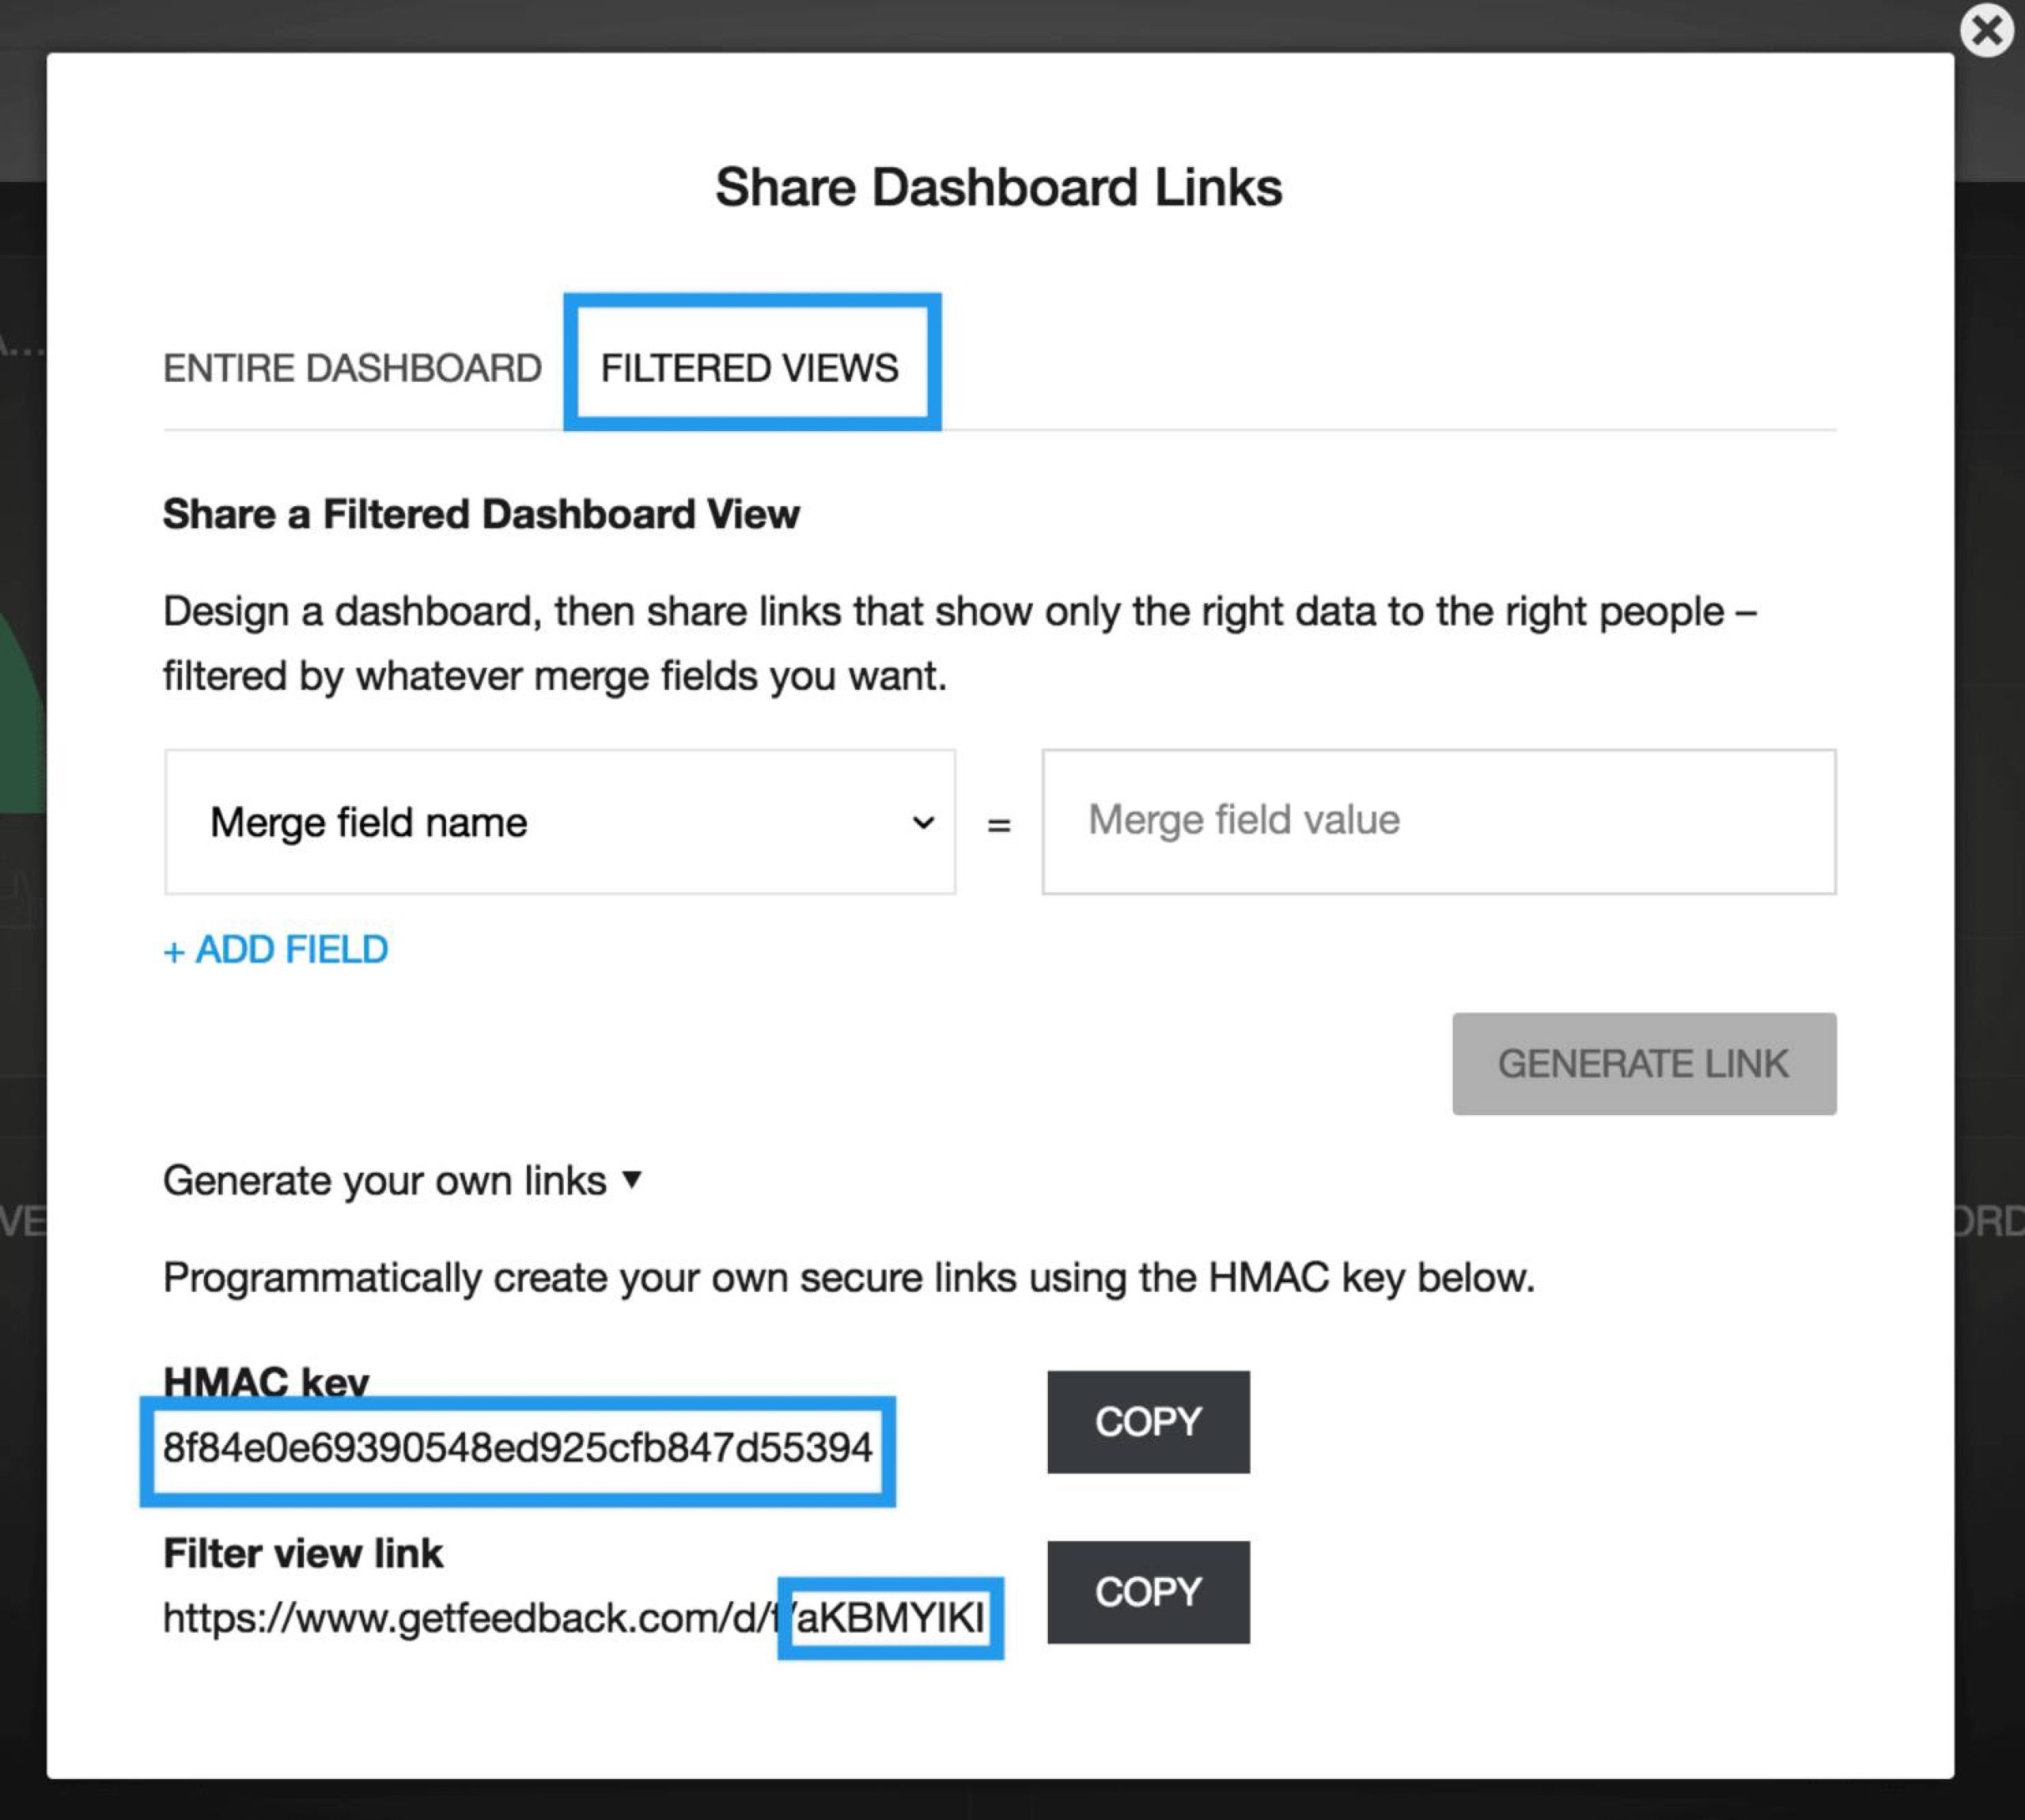
Using Filtered GetFeedback Dashboards in Salesforce
Set up unique survey dashboards for each of your teammates, support agents, or stakeholders using dynamic dashboard filters. Setting up dynamic dashboard filters helps you make the most of your GetFeedback dashboard reporting within Salesforce. Learn more about GetFeedback dashboards.
Input String Structure for HMAC Key
Before implementing filtered dashboards in your own Salesforce Org, it's important to understand the link structure of GetFeedback’s dashboards and how to use the HMAC key that will validate the dashboard link.
The example below explains the GetFeedback dashboard link structure.
| https://www.getfeedback.com/d/f/[DASHBOARD_TOKEN]?[QUERY_PARAMETERES]&gf_hmac=[HMACSIGNATURE] |

When using filtered dashboard links:
- Don’t include the starting question mark “?” or the trailing ampersand “&” when generating your HMAC signature based on a given set of query parameters.
- Include ampersands appearing in the middle of your query parameter string.
- Retrieve your own unique dashboard token and encryption keys from the filtered dashboard view in GetFeedback. Instructions are provided below.
Setting Up Filtered View
To set up filtered GetFeedback dashboards in Salesforce:
- In GetFeedback, create or open your survey dashboard.
- Select the arrow icon in the top right corner.
- Select the Filtered Views tab, then select Generate Your Own Links.
- Copy the HMAC Key and Dashboard token (it’s the part after f/ in the Filter view link).
- In Salesforce Setup, create a new Custom Label with the name GF_HMAC_Key. Enter your HMAC key from Step 4 as the value.
- In Salesforce Setup > Object Manager, create a new field on the User object with a URL data type. This field will store the link from the Apex Trigger that you’ll create in the next step.
- Add the following Apex Trigger named gfHMACTrigger to yourNew- Salesforce Org.Make sure to enter your dashboard token, Custom Label, and URL Field API names in the Apex Trigger:
- trigger gfHMACTrigger on User (before Update) {
for (User u : Trigger.New) {
u.GetFeedback_Filtered_Dashboard__c = 'https://www.getfeedback.com/d/f/
[DASHBOARD_TOKEN]
?agent=' + UserInfo.getUserId() + '&gf_hmac=' +
EncodingUtil.urlEncode(EncodingUtil.base64Encode(Crypto.generateMac('HmacSHA256',
Blob.ValueOf('agent=' + UserInfo.getUserId()), Blob.ValueOf(System.Label.GF_HMAC_Key ))),'UTF-8')); }
}
- trigger gfHMACTrigger on User (before Update) {
- When sending surveys, make sure to append the values required for any and all of your filtering criteria as merge fields in the survey link. For example:
- https://www.getfeedback.com/r/[survey_token]?agent=005360000038S2DAAU
Now, your Salesforce users can click their personalized dashboard links under their user profile to open their filtered dashboard view