GetFeedback
Web Feedback Dashboard
View and analyze feedback from web-based forms using several different dashboards.
Key Insights for Web
Key Insights highlights trends and changes in your feedback to help you reduce time spent on manual feedback analysis.
Viewing Key Insights
To view Key Insights, select Dashboard in the left side menu. If you want to explore one of the insights further, select the insight to go to a filtered view with relevant feedback.
By default, the dashboard only shows feedback from the last 30 days. If you don’t see any insights, try expanding the date range using the filters at the top right.
Key Insight Types
Here is a list of the different key insights you might see. We only show insights that are relevant to your feedback items, so your insights may change over time and show different trends as your data changes.
| Insights | Description |
| URL | The survey link that collected the lowest average mood score. |
| # of feedback items | The date with the greatest number of the lowest mood scores. |
| Label | The number of feedback items containing the label "bug." |
| Feedback items (% increase) | The increase in feedback items on the day when the most feedback came in. |
| Browser | The browser with the greatest number of the lowest mood scores. |
| Operating system | The operating system with the greatest number of the lowest mood scores. |
| Country | The country with the greatest number of the lowest mood scores. |
Providing Feedback on Insights
Use the thumbs up and thumbs down buttons on your insights to let us know if the information was helpful. We use your feedback to improve Key Insights.

Campaign Overview for Web Forms
Analyze feedback from your full screen and slide out web surveys by using the Campaign Overview.
Viewing Campaigns and Results
To access your web campaigns and their results, go to the Campaigns section of the left-side menu, then select Overview.
The Overview page shows each campaign you have access to. You can view the created date, how many people have viewed and completed the form, and whether the campaign is active. Sort and filter the page to find specific campaigns.
- To sort the campaigns, select a column title (type, name, creation date, performance, or status).
- To filter the campaigns, select the Filter by dropdown in the top right corner and select one of the filter options:
- Creation date
- Campaign types
- Button
- Status
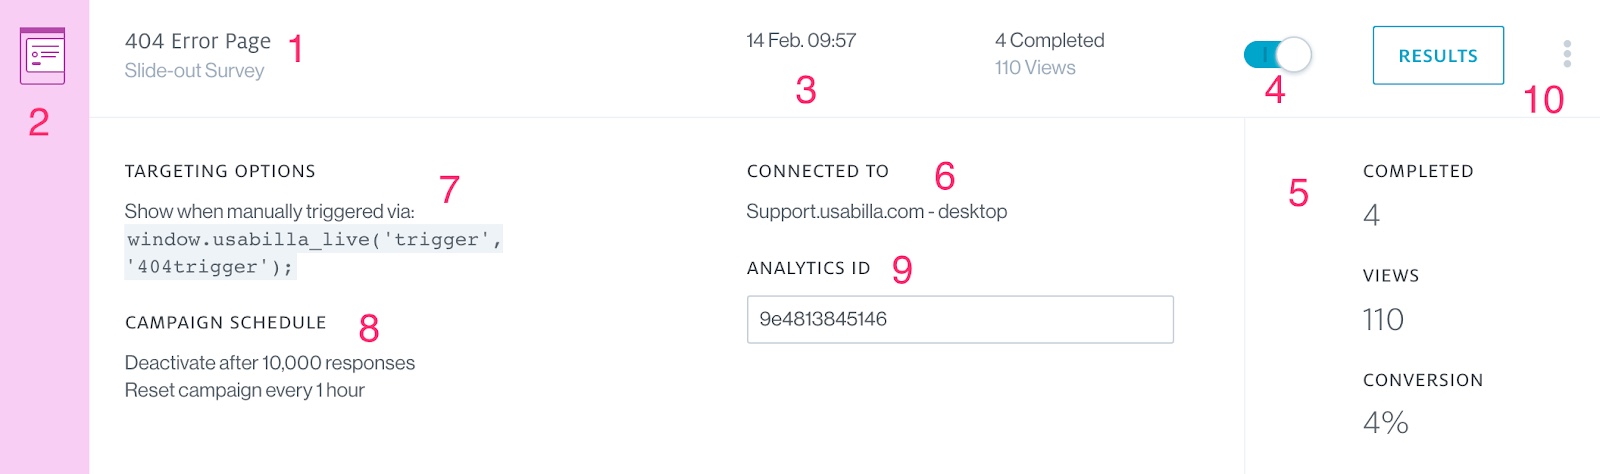
- Campaign title: only visible to you, not respondents.
- Campaign type: Type of campaign (full survey, slide-out survey, recruit campaign, or boost campaign).
- Creation date: Date your campaign was created.
- Campaign status: Turn the toggle on or off to change the campaign status.
- Campaign performance: Number of responses, views, and the conversion for this campaign.
- Button: Feedback button your campaign is connected to.
- Targeting options: Trigger that determines when and where your campaign appears.
- Campaign schedule: Start and end dates or conditions.
- Analytics ID: An ID that allows you to identify this specific campaign if you integrate GetFeedback with your analytics suite.
- Editing options – Select the three dots to edit your campaign.
To view campaign feedback, select Results on the campaign you want to view. You can filter the campaign results using the left-side filter panel.