SurveyMonkey
Crosstab Reports
Crosstabs
Crosstab reports let you compare multiple questions and answer choices in a data table. A crosstab displays how many times an answer choice was selected, the percentage of responses, and the total number of responses per answer choice.
Creating a Crosstab Report
Crosstab reports can display all of the data from your survey. To further break down your results, apply a Saved View.
To create a crosstab:
- Go to the Analyze Results section of your survey.
- Select Rules from the toolbar, then click + Compare.
- Click Create a crosstab report to open the Crosstab Setup window.
- Click the pencil icon next to the title to rename your crosstab report. By default, your crosstab report's name is the survey title.
- Select the Views dropdown to decide what data to include in your report:
- To show filtered data, select a Saved View.
- To see all of your data, select Original View.
- To limit the answer options you display, click the pencil icon next to a question.
- Drag and drop questions from the left side of the screen into the Rows and Columns sections.
- Click Next.
- Drag and drop your questions in the Rows or Columns sections to change their display order.
- Click Create Crosstab Report.
Available Question Types
You can include the following question types in a crosstab:
- Multiple Choice
- Checkboxes
- Dropdown
- Image Choice
Crosstab Limitations
- You can add up to 5 questions to the columns, and up to 10 questions to the rows.
- Crosstab reports aren't available for surveys with more than 100 questions.
- It's not possible to apply a Saved View that includes Compare or Show rules to a crosstab report.
- Crosstabs don't support Combined Filters.
- Demographic information from SurveyMonkey Audience responses isn't available in a crosstab report.
Reading a Crosstab Report
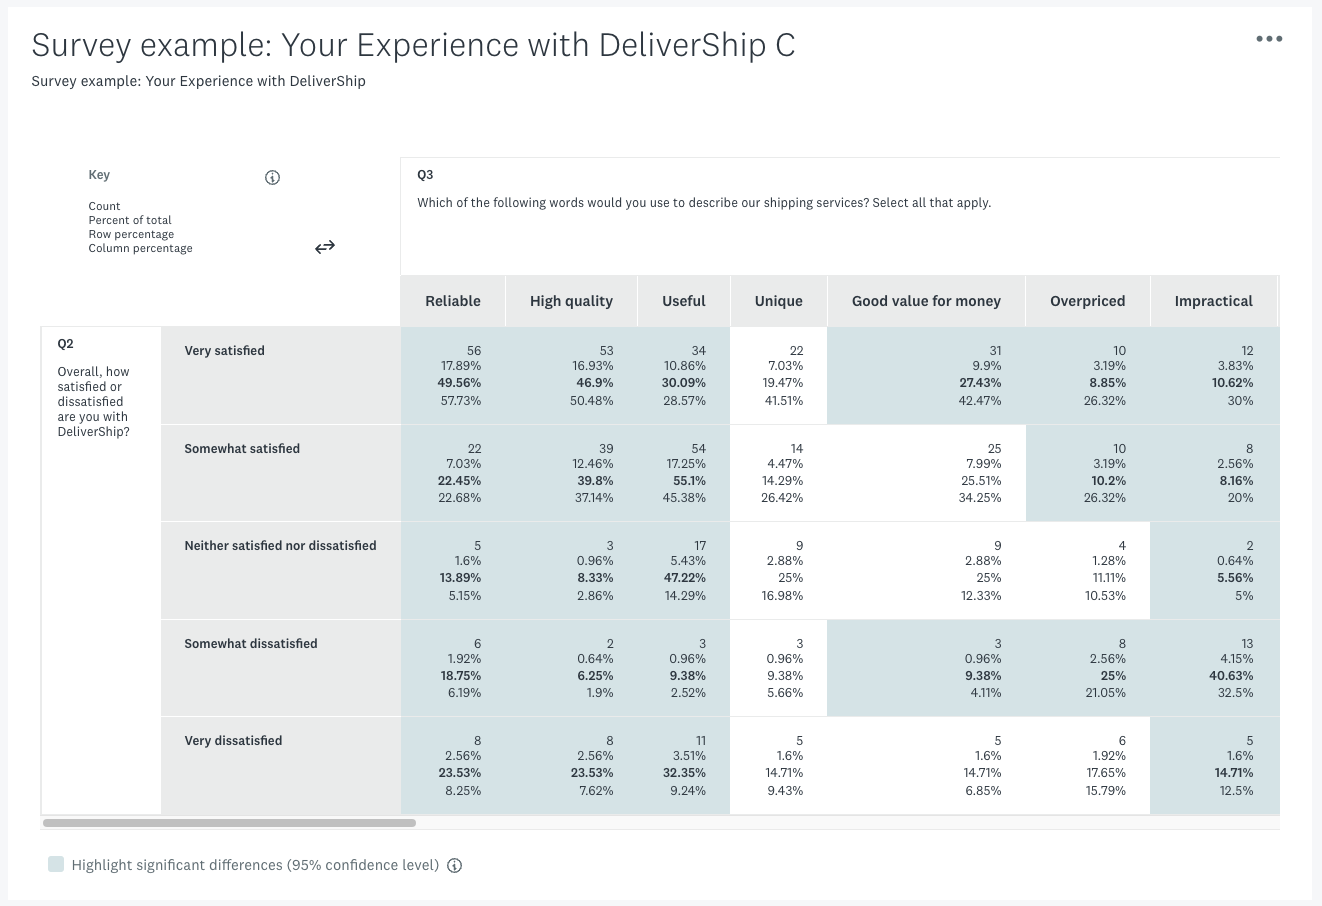
Each cell in the crosstab report includes 4 stats, in this order:

- Count: The number of responses that fall into this row and column.
- Example: In the image above, the number 56 in the top row means that 56 responses chose both Very Satisfied and Reliable.
- Percent of total: The percentage of all responses that fall into this row and column.
- Example: In the image above, 17.89% in the second row means that 17.89% of all survey takers chose both Very Satisfied and Reliable.
- Row percentage: The percentage of this row that falls into this column.
- Example: In the image above, 49% in the third row means that 49% of the survey takers who chose Very Satisfied also chose Reliable.
- Column percentage: The percentage of this column that falls into this row.
- Example: In the image above, 57.73% in the fourth row means that 57.73% of the survey takers who chose Reliable also chose Very Satisfied.
Open the dropdown below to view an example of a crosstab report.
- Crosstab Report Example
Editing a Crosstab Report
To edit a crosstab report:
- In the Analyze Results section of your survey, select Dashboards and Crosstabs.
- Find the dashboard you want to share, then select View
- In the upper-right corner, click the three dots menu.
- Select Edit.
- Update the crosstab report by going through the crosstab setup.
If you want to share your results, you can publish and share your crosstab report. If your survey is still open and collecting responses, the report will update automatically as more people take your survey.
To share a crosstab report:
- In the Analyze Results section of your survey, select Dashboards and Crosstabs.
- Find the dashboard you want to share, then select View.
- In the upper-right corner, click the three dots menu.
- Select Publish.
- Click the toggle to turn Link sharing on.
- Copy the link and share your crosstab report anywhere.
If you need to remove access to your crosstab report after you share it, turn sharing off by clicking the Link sharing toggle again. Then, the report won't be available when someone visits the link or refreshes their browser.
Exporting a Crosstab Report
You can download your crosstab report as a CSV file.
To export a crosstab report:
- In the Analyze Results section of your survey, select Dashboards and Crosstabs.
- Find your crosstab report, then select View.
- In the upper-right corner, select the three dots menu.
- Select Download.