SurveyMonkey
Tracking Email Invitations
If you send your survey via email invitation, you can track how many people opened your invitation, clicked through to the survey, responded to your survey, or opted out of your survey in the Overview tab of the collector.
Opened & Clicked Through Rates
By tracking the opened and clicked through rates of your email invitations, you can identify where respondents need help and send more effective follow-up emails.
- Opened Rate
- Clicked Through Rate
- Click-to-Open Rate
Invitation Tracking Setting
Invitation Tracking
Track how many people opened your invitation and clicked through to your survey in the Overview tab of the collector. You need to keep Invitation Tracking turned on—it's turned on in the collector options by default.
Invitation Tracking has two settings:
- On, show how many people opened your email invitation and clicked through to your survey
- Off, don’t show how many people opened your email invitation and clicked through to your survey
Invitations Chart
Opened & Clicked-Through Rates
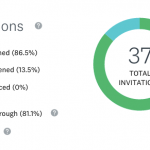
The Invitations chart tracks how recipients interact with your email invitations. This chart includes useful data like how many recipients opened the email invitation and how many recipients clicked through to your survey.

Label | Description |
| Total Invitations | The total number of email invitations sent to individual email addresses in the collector. This is also the total number of recipients added to the collector. |
| Opened | The minimum number of recipients who opened the email invitation in their email client—more people may have opened the email invitation because:
|
| Unopened | The maximum number of recipients who haven't opened the email invitation. It's possible more recipients opened it but weren't counted (see info on Opened in the row above). |
| Bounced | The number of recipients whose email invitation bounced and couldn't be delivered. |
| Clicked Through | The number of recipients who clicked through to the survey by clicking the Begin Survey button (or clicked the survey link). |
| Opted Out | Recipients who opted out from receiving surveys sent through your SurveyMonkey account. |
Responses Chart
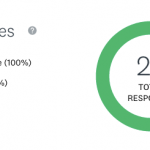
The Responses chart tracks how recipients interact with your survey. This chart includes useful data like how many people responded to the survey, how many people completed the survey, and how many people only partially completed the survey.

Label | Description |
| Total Responses | The total number of recipients who clicked through AND responded to the survey. Includes both Complete or Partial responses. Not all recipients who clicked through will respond to the survey. |
| Complete | Recipients who finished your survey—clicked the Done button at the end of the survey. Includes Complete, Disqualified, and Over Quota responses. |
| Partial | Recipients who started but didn't complete the survey—they responded to at least one survey question and clicked Next on at least one survey page, but didn't click Done on the last page of the survey. |
| Not Responded | Recipients who haven't submitted a survey response. To calculate the number of Not Responded, subtract the number of Total Responses from the number of Total Invitations. This info is also in the Recipients tab. |
Common Questions
- How do I view individual recipients or responses?
- What if a recipient opts out?
- What if I send a single recipient multiple messages?
- Why don't I see Opened or Clicked Through in my chart?
- Can I track invitations but still keep their responses anonymous?