SurveyMonkey
Usage and Attitudes
Our Usage & Attitudes solution helps you learn about your customers’ preferences, habits, and purchase behaviors that drive attributes like frequency of use and likelihood to purchase.
Setting Up Your Project
Getting Started
Check out our Market Research Solutions page to learn more about Usage & Attitudes projects. Click Get Started when you're ready to start building your project.
Enter your project details
These include your company name or logo and are automatically added to the first page of your survey.
Choose your target audience
- Select your target audience by choosing Country, Gender, Age, and Income criteria.
- Click More Targeting Options to browse and choose from hundreds of other targeting options.
- (Optional) Add a screening question to narrow down your target audience, and disqualify people who aren't the best fit for your survey. This is useful if you didn't find all the targeting options you wanted.
- To get an accurate cost estimate, choose how many questions will be in your survey. You'll be able to review the final cost based on the length of your survey before purchasing at checkout.
- Review the cost and estimated completion date. If everything looks good click Next: Design Survey.
Decide what analysis features you want to use
Some features are only available with certain question types and settings. Check out the Advanced Analysis Features section for more details.
Design your survey
- Add custom questions to your survey or use the question bank specifically designed for Usage & Attitudes projects. You can edit questions from the question bank to fit your research goals.
- (Optional) Apply any logic features. All logic types are supported, except quotas and custom variables.
- Customize your survey style.
Preview your survey
Once your project is set up, click Preview to make sure it looks good. Toggle between Desktop, Tablet, and Mobile views to see how your survey will look on various devices.
Checkout & payment
You don't need a specific plan type to run your project. Before you checkout, we'll ask you to review your order details. You'll see a breakdown of the total cost, and can go back to make any last-minute adjustments to your targeting criteria.
Projects can be purchased with a debit or credit card, or with Audience Credits.
Analyze & export results
The Analyze tab will show you summaries of all your questions, let you use the advanced analysis features, and export your data.
Available export formats:
With PPT exports, you'll be able to customize and edit the slides in PowerPoint after exporting.
Advanced Analysis Features
We have specialized analysis features to help you understand your customer's habits better. If you want to use these features, there are certain things to keep in mind when designing your survey.
Key Driver Analysis

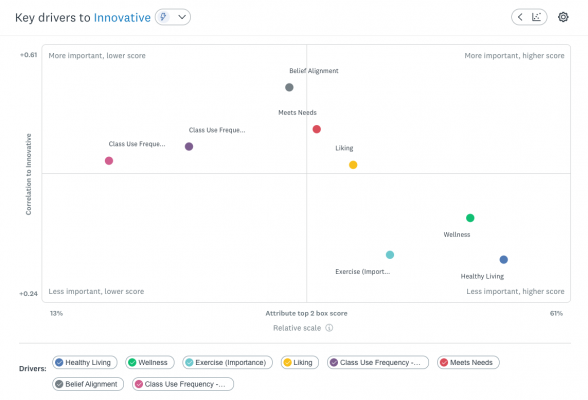
Key Drivers allow you to choose an outcome metric and then see which attitudes and behaviors of your customers have the highest correlation with that outcome.
For example, you could choose the outcome metric of purchase intent then see data points about what drives people to purchase.
Setting Up Your Survey to Use Key Drivers
The only question type compatible with Key Drivers is the Multiple Choice question. How you set it up depends on what you want to analyze:
- Outcome metrics use a multiple choice question with 2-7 answer choices.
- Data points are created from multiple choice questions with the same number of answer choices as the outcome metric.
- Example
Viewing Key Drivers in Analyze
When you're ready to Analyze your data:
- Go to the Analyze section of your project.
- Click the dropdown menu on the right side of the page and select Key Drivers.
- Click the blue text above the chart to choose your settings.
- Choose your outcome variable from the dropdown and preferred chart scale.
- Click Save.
- To see our recommendations based on this outcome metric, click the Insights icon above the chart.
AI Powered Insights
AI insights help you understand your data by recommending filters that significantly change the question distribution.
Setting Up Your Survey to Use AI Insights
| Question type | Insights | What you see |
| Multiple Choice | What scored well vs what didn't score well. | See the top 3 insights per compatible question. Only displays insights that have 95% significance (0.05 p-value). |
| Checkbox | Significant changes to the answer distributions. | Filter sets that most significantly change the answer option distribution. |
- How insights are calculated
See AI Powered Insights in Analyze
When you're ready to Analyze your data:
You can also click the Insights icon on your question charts. If you can't click the icon, it means no insights were found for that question.
- Go to the Analyze section of your project.
- Click Auto Insights.
- Check which metrics you want to show.
- Choose whether you want to group insights by Metric or Score.
You can also click the Insights icon on your question charts. If you can't click the icon, it means no insights were found for that question.
Filters & Crosstabs
Filters and crosstabs help you view a specific subset of your data.
Filters
To get started, click ø Filters at the top of the Analyze page. Select options break down your results even further by choosing the criteria you want to focus on. You can only apply 1 filter at a time.
You can save filters for future use on your same browser and device. It's not possible to share filters.
Crosstabs
Click the dropdown menu on the right side of the Analyze page and select crosstabs. Choose the rows and columns you want to see, then click Next to see a preview. You can name and save your crosstab to come back to it again later, or export it to a .CSV file.