- Accessing Insights
- Workspace Roles and Access
- Creating a Workspace
- Editing a Workspace
- Duplicating a Workspace
- Deleting a Workspace
- Creating a Tile
- Selecting Questions to Visualize
- Tile Visualization Options
- Choice Tile Visualizations
- Open Text Tile Visualizations
- Editing a Title
- Organizing Tiles
- Deleting a Tile
- Exporting Workspace Data
GetFeedback
Creating Workspaces
- Accessing Insights
- Workspace Roles and Access
- Creating a Workspace
- Editing a Workspace
- Duplicating a Workspace
- Deleting a Workspace
- Creating a Tile
- Selecting Questions to Visualize
- Tile Visualization Options
- Choice Tile Visualizations
- Open Text Tile Visualizations
- Editing a Title
- Organizing Tiles
- Deleting a Tile
- Exporting Workspace Data
Our Insights analysis platform lets you combine survey responses from different digital touchpoints, including websites, emails, mobile applications, and custom environments to get a holistic view and pulse of your key metrics. Create workspaces and add tiles to view and analyze data from multiple sources.
In a workspace, you can:
- Create and share charts based on NPS, Mood or Rating questions
- Compare different survey and form results in order to track and report on your main KPIs
- Filter data to uncover opportunities
- Share a story that is meaningful and impactful to your organization
Accessing Insights
To access the Insights platform, select Insights from the left navigation in app.usabilla.com or app.getfeedback.com. Insights will open in a new browser tab. Bookmark the page for quick access.
Insights Roles and Access
There are 2 roles in Insights: administrator and collaborator. If you're an admin in GetFeedback, you'll be an administrator in Insights. The table below shows what Admins and Collaborators can do in Insights.
| Administrators | Collaborators | |
| Create a workspace | - Create new workspaces - Invite team members to a new workspace - Allow non-admin team members to create and manage workspaces | - Can't create new workspaces, unless an administrator grants permission |
| Edit an existing workspace | - Edit existing workspaces - Manage access to existing workspaces | - Can't edit existing workspaces, unless an administrator grants permission |
| Delete a workspace | - Delete workspaces | - Can't delete workspaces, unless an administrator grants permission |
| View a workspace | - View all workspaces | - View the workspaces they have access to |
| Create a tile | - Create new tiles | - Can only create tiles for the workspaces they have access to, unless an administrator grants permission |
| Edit an existing chart | - Edit any existing chart | - Can only edit charts for the workspaces they have access to, unless an administrator grants permission |
Creating a Workspace
To create a workspace:
- Go to Insights. From app.usabilla.com or app.getfeedback.com, select Insights from the left sidebar.
- Select New Workspace from the top left corner.
- Name your workspace at the top of the screen.
- (optional) Add a description of your workspace at the top of the screen. You may want to include what data types or forms you’re analyzing.
- Select Continue.
- Check the boxes for the forms you want to include in your workspace. You can search for forms or sort the list by Platform, Created date, or Status.
- Select Continue To Permissions.
- Choose the access level for your workspace:
- Unrestricted: Anyone can view your workspace.
- Restricted: Only administrators and people you give access to can view your workspace.
- Select Create Workspace.
Editing a Workspace
Administrators can edit a workspace at any time to change the title and description, add or remove forms, or change permissions.
To edit a workspace, select the three dots in the top right corner, then select an editing option.
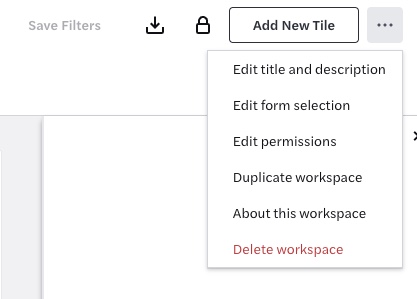
Duplicating a Workspace
Duplicate a workspace to copy all visualizations, forms, and permissions. To duplicate a workspace, select the three dots in the top right, then select Duplicate workspace.
Deleting a Workspace
Administrators can delete a workspace at any time. The workspace will be deleted for all team members and can’t be recovered.
To delete a workspace:
- Select the three dots in the top right, then select Delete workspace.
- At the confirmation, select Yes, Delete.
Creating a Tile
Tiles are charts and other visualizations that help you analyze data in your workspace. After creating your workspace, select Add New Tile to add a tile to your workspace.
Naming Your Tile
At the top of the page, give your tile a title (140 characters max) and an optional description (140 characters max). Consider using a short title and providing more detail in the description. You can edit both the title and description later.
Choosing Your Tile Type
Choose the type of data you want to display in your chart. You can choose from the following data types:
- NPS
- Average Sentiment (Mood)
- Average Score (Rating)
- CSAT %
- Single Choice
- Multi-Choice
- Open Text
- Polar Choice
- Slider
After choosing your tile type, select Continue to Data.
Selecting Questions to Visualize
Select the surveys you want to include data from. You can select any survey with questions that are relevant to the chart type you selected. For example, if you chose an NPS chart in your previous step, you can choose any surveys that have an NPS question.
After choosing the surveys to include, select Continue to Visualization.
- Closed questions (Mood, NPS, Rating, and Slider): Choose from Score over time, Score distribution, Score composition, or Single score.
- Open text questions: Choose from List view, Key phrases, Top key words, or Contextual Sentiment.
Note: Some options may not be available for all open text question types. - Multi-Choice questions: Use the Answer distribution visualization.
After picking your visualization, select Create Tile. Your new tile appears in your workspace.
Tile Visualization Options
Score Tile Visualizations
Score tiles can include NPS, CSAT, Mood, Rating, and Slider question types.
| Visualization Option | Chart Type | Description |
| Score over time | Line chart | Shows the change in score change over the selected time period. Display options: - One trend line per question: Display one trend line per question - Different colors: If you selected one trend line per question, choose to give each trend line a different color. - Overall results trend line: Display a single trend line with the combined average question score. - Margin of error: Display a margin for your trend lines that show the maximum amount that your results are expected to differ from the actual population. This option isn't available if there are less than 30 responses. - Rating score line for the period: Displays a dotted line representing the average score for the period. |
| Score distribution | Bar chart | Shows responses in a vertical bar chart broken down by score. Display options: - Y axis labels: Choose to display the number of responses and/or percentages. - X axis labels: Select how to sort your responses, depending on the question type–lowest to highest or highest to lowest, detractors to promoters or promoters to detractors, etc. - Color: Choose a color for your visualization. - Visualization style: Choose to display your score with either numbers or stars (only available for the Rating question type). |
| Score composition | Donut chart | Shows scores as percentages in a donut chart. Display options: - Group results by detractors, passives, and promoters: Only available for NPS and CSAT questions. - Display in sentiment colors: Only available for Mood/CSAT questions. - Visualization style: Choose to display your score with either numbers, satisfaction labels, or stars. Only available for the Rating questions. |
| Single score | Single digit visualization | Shows a single-digit average score for your questions. Display options: - Show comparison to previous period: Display percentage of how much the score changed over your previously selected time frame–week over week, month over month, etc. |
Choice Tile Visualizations
Choice tiles can include single choice, multi-choice, and polar choice questions.
| Visualization Option | Chart Type | Description |
| Answer distribution | Bar chart | Compares the number of responses for each answer option in a horizontal bar chart. Display options: - Merge answers with the same identifiers: - for GetFeedback Digital, merge answers with matching answer identifiers. - for GetFeedback Direct, merge answers with matching answer text. - Display all answers separately: if you want to display all answers separately instead of merging them, you can choose to display the form names and different colors for each answer. - Color: choose a color for your visualization. |
| Answer composition | Donut chart | Shows the number of responses for each answer option as a percentage. Display options: - Merge answers with the same identifiers: - for GetFeedback Digital, merge answers with matching answer identifiers. - for GetFeedback Direct, merge answers with matching answer text. - Display all answers separately: if you want to display all answers separately instead of merging them, you can choose to display the form names and different colors for each answer. Only available for questions with a maximum of 7 answer options. |
Open Text Tile Visualizations
Open text tiles can include short answer and comment fields.
| Visualization Option | Chart Type | Description |
| List view | List | Shows a list of text responses left in short answer or comment fields. |
| Key phrases | Bar chart | Lists the most commonly mentioned phrases and how often they were used in responses. Display options; - Select which languages to display on your title, including the option to translate all languages to English. - Choose a color for your visualization. |
| Top key words | Bar chart | Lists the most commonly mentioned words and how often they were used in responses. Display options: - Select which languages to display on your tile, including the option to translate all languages to English. - Choose a color for your visualization |
| Contextual sentiment | Bar chart | Shows the sentiment of words and phrases used in text responses. |
Editing a Title
You can edit a tile's title, description, selected data, and selected visualization at any time.
To edit a tile, select the three dots in the top right of the tile, then select an edit option.
Organizing Tiles
When you have added all the tiles you want in your workspace, you can reorganize your tiles. You can have up to 2 tiles in a row.
To move a tile, select and hold the 6 dot icon at the top of the tile, then drag it to the desired location. You can also place the tile next to another tile.
Deleting a Tile
To delete a tile from your workspace:
- Select the three dots in the right hand corner of the title.
- Select Delete file.
Filtering a Workspace
Filter your workspace by question types, responses, and more. Your filters apply to every tile in your workspace. Learn more about workspace filters
Exporting Workspace Data
Create exports for your workspace data. You can export data to an XLSX or CSV file.
To create exports in a workspace:
- Select Exports in the top right corner.
- Select New Export.
- Enter a File name, then select a File format.
- If desired, toggle on to Merge questions with the same identifier. This option allows you to merge the responses of questions with the same value in one column. For example, if your workspace contains 3 forms that have a 'Comment' field with the value 'How_can_we_improve', you can consolidate the responses into one column.
- Select Create. You’ll get a confirmation message about your export.
- When your export is ready, select Exports again and download your file.