GetFeedback
NPS Key Driver Analysis
In app.getfeedback.com, the Key Driver Analysis is a Net Promoter® Score (NPS) follow-up question and dashboard tile.
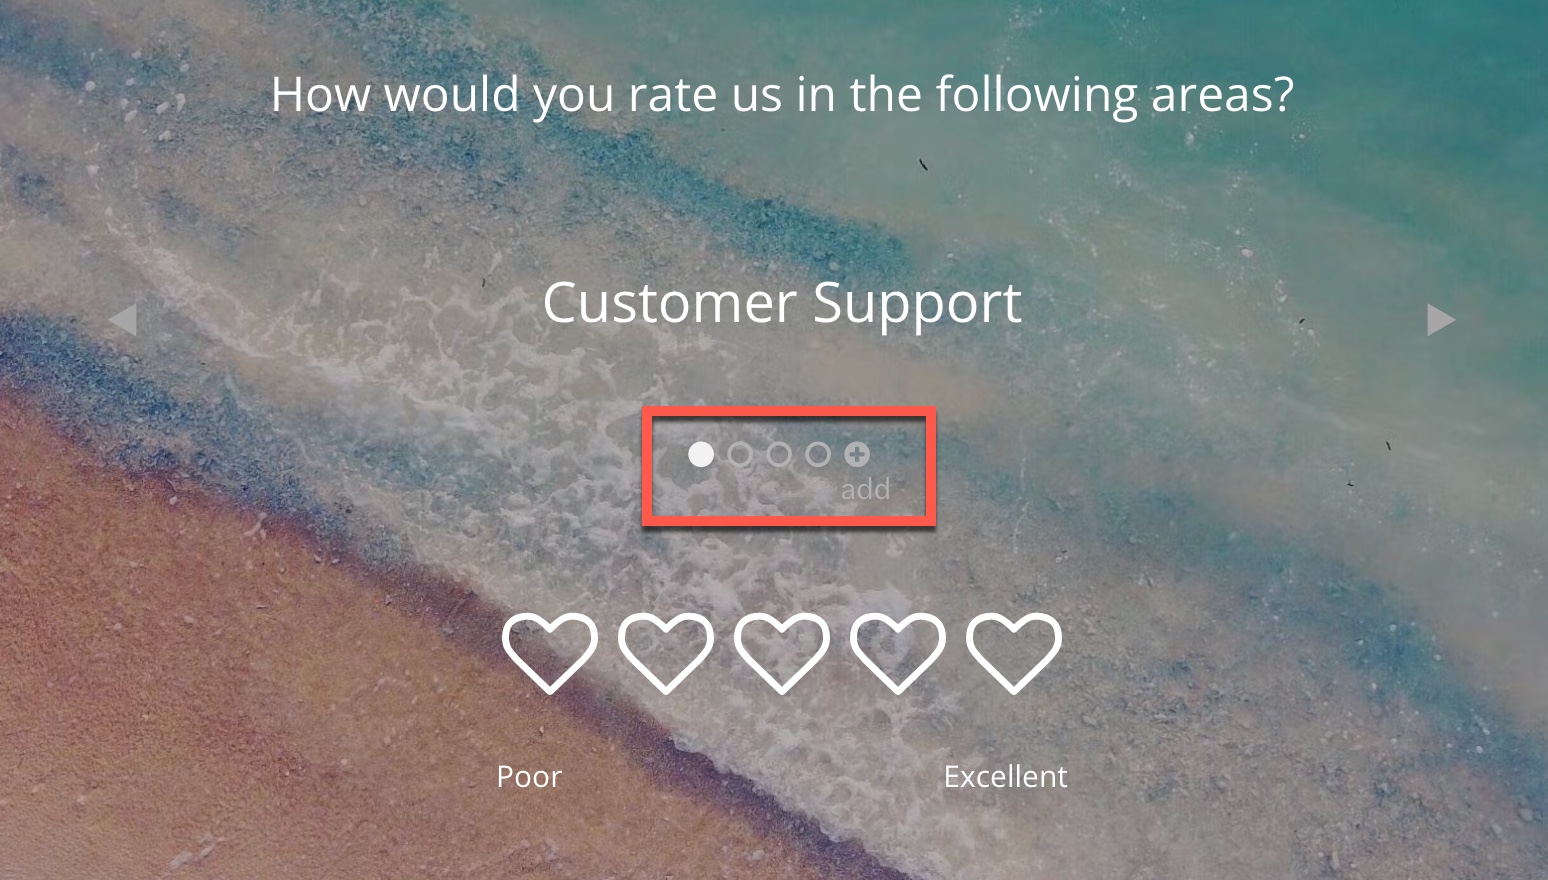
The Key Driver question is a structured follow-up question that asks, “How would you rate us in these areas?” You can customize the question to include key areas of your business so you can measure their impact on your customer experience.
The Key Driver dashboard tile displays results from your key driver question to help you identify the business areas impacting your score. The tile results can help you proactively make changes to improve customer loyalty.
Best Practices for Key Driver Questions
- Set up your question with the low score on the left side of the survey builder and the high score on the right side (for example, 0-10 or Poor - Excellent). Switching the direction of the response may cause negative correlation and add a warning to the dashboard tile.
- Phrase your key drivers positively. For example, use "Breadth of inventory" instead of "Inventory shortfalls."
- Key Driver questions that use shapes (hearts, stars, or circles) must have at least 5 shapes to make sure you get a range of responses to track trends.
- We recommend collecting at least 30+ responses to help you get better data trends.
Using the Key Driver Question
You can create a new NPS survey with a Key Driver question or add it to an existing survey.
Creating a New NPS Survey
- In the survey builder, select +Add Question, then select Key Driver.
- Enter a Potential Driver you want your customers to rate, such as Customer Support or Delivery Speed.
- To add more drivers, select add below the Potential Driver field.
Adding Key Driver to an Existing NPS Survey
If you’re already using an NPS survey, you can add the Key Driver question to your survey. However, you should keep any existing questions to avoid deleting previous responses. There are two ways to add a Key Driver question without deleting existing questions:
- Add a Key Driver question to your existing survey and use survey branching logic to skip over the original follow-up question and preserve previously collected responses. When viewing feedback, you can compare key driver results to previous responses.
- Copy your existing NPS survey and change the original follow-up question (likely multiple choice) to the Key Driver question type. To view feedback, compare your old and new NPS surveys side by side in your GetFeedback dashboard or Salesforce reporting.
(Optional) Map Responses to Salesforce and Zendesk
Map your Key Driver responses to a custom Key Driver field in Salesforce or Zendesk.
- In Salesforce, you can map Key Driver responses to Number, Text, or Text Area fields. Make sure to map each Key Driver item to its own field in Salesforce. Learn more about compatible Salesforce fields
- In Zendesk, you can map Key Driver responses to Number, Decimal, Drop-down, or Text fields. Learn more about compatible Zendesk fields
Learn how to set up Salesforce custom mappings or Zendesk custom mappings
Key Driver Dashboard Tile
In your app.getfeedback.com dashboard, measure the correlation between your NPS score and key drivers to understand which areas of your business are impacting your customer loyalty. The key driver dashboard tile highlights the areas affecting your business so you can improve customer experience.
Adding the Tile
In your dashboard, select New Tile. Then, select your survey and the Key Driver question.
Reading the tile
Here’s an explanation of the tile results.
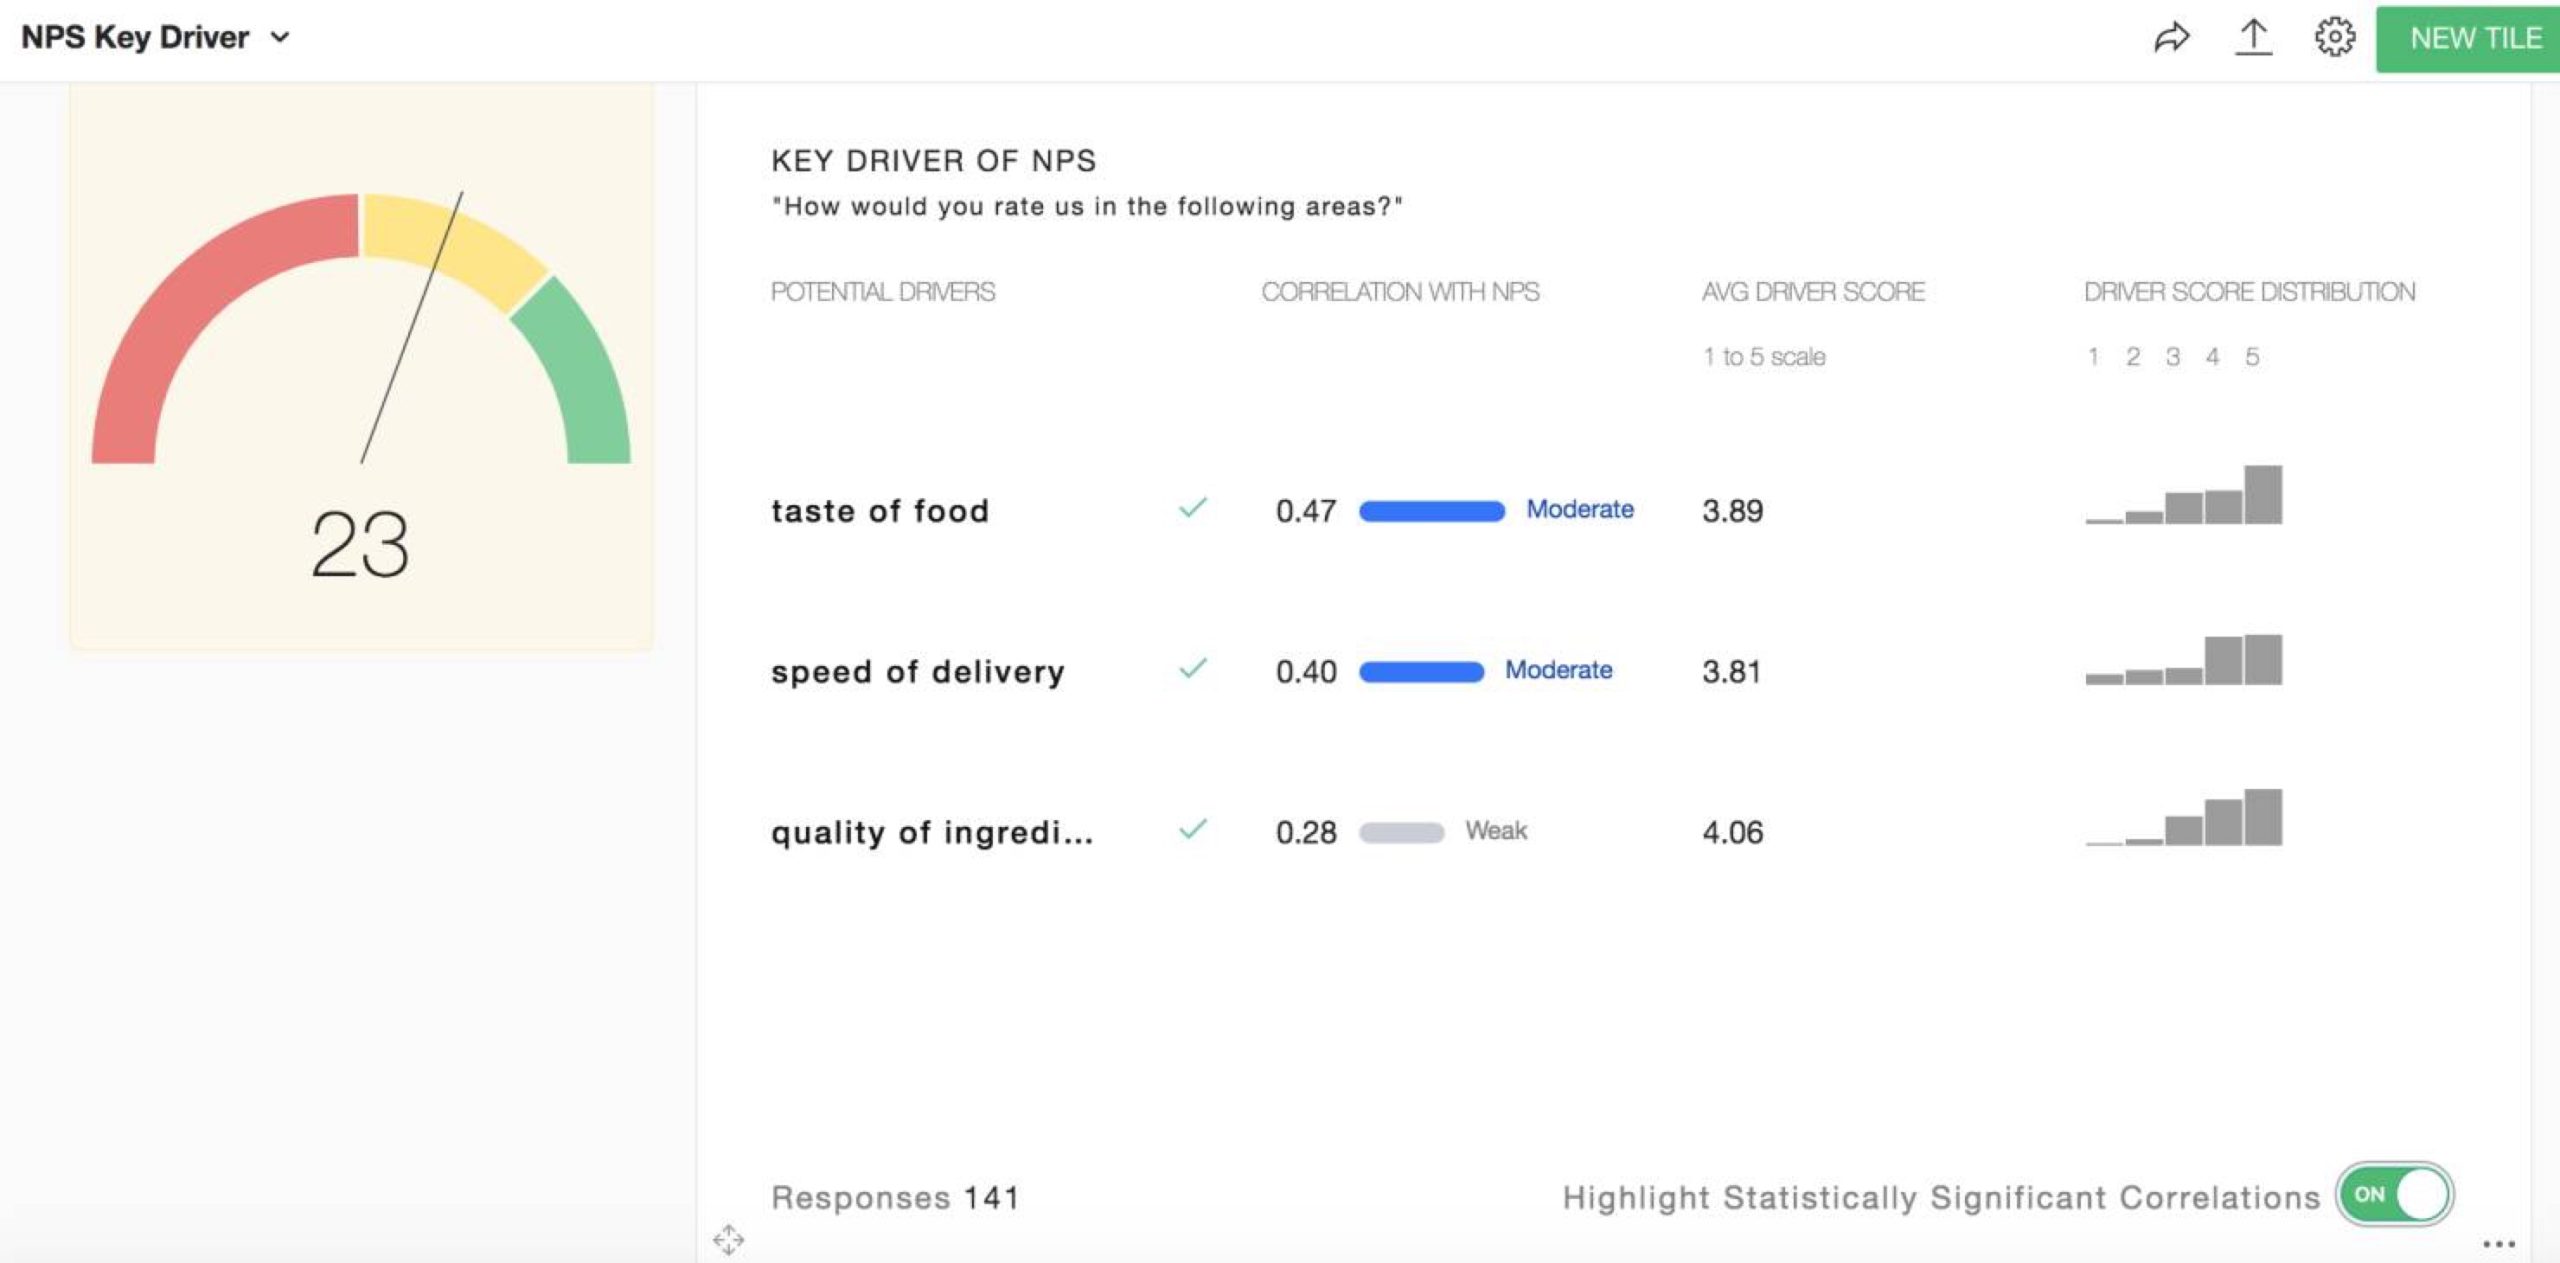
- Potential driver: The business areas you included in the Key Driver question. Potential drivers are areas of your business that mayyou affect your customers’ brand perception and loyalty..
- Correlation with NPS: How much the potential driver’s scores vary with NPS scores. When you observe a high driver score, you also observe a high NPS score; a low NPS score matches a low driver score.
For example, if you have a low NPS score with low correlation to your potential driver, that driver may not be affecting your NPS score. - Average driver score: The average score respondents gave to a driver, which shows overall customer satisfaction with a potential driver.
- Driver score distribution: The spread of your response scores.
Understanding Your Key Driver Score
We use Spearman's rank correlation on the NPS score and Key Driver question to calculate your correlation score.
Hover over your dashboard tile to highlight the statistical significance of the data (also called the P Score). The statistical significance helps us understand how likely it is that the score is accurate.
- Strong correlation and high average driver score: Key value driver
- Strong correlation and low average driver score: Key pain point
- Weak correlation and a high average driver score: Possible area to remove investment
- Weak correlation and a low average driver score: No action recommended