Help Center
In this article
GetFeedback
NPS Crosstab Analysis
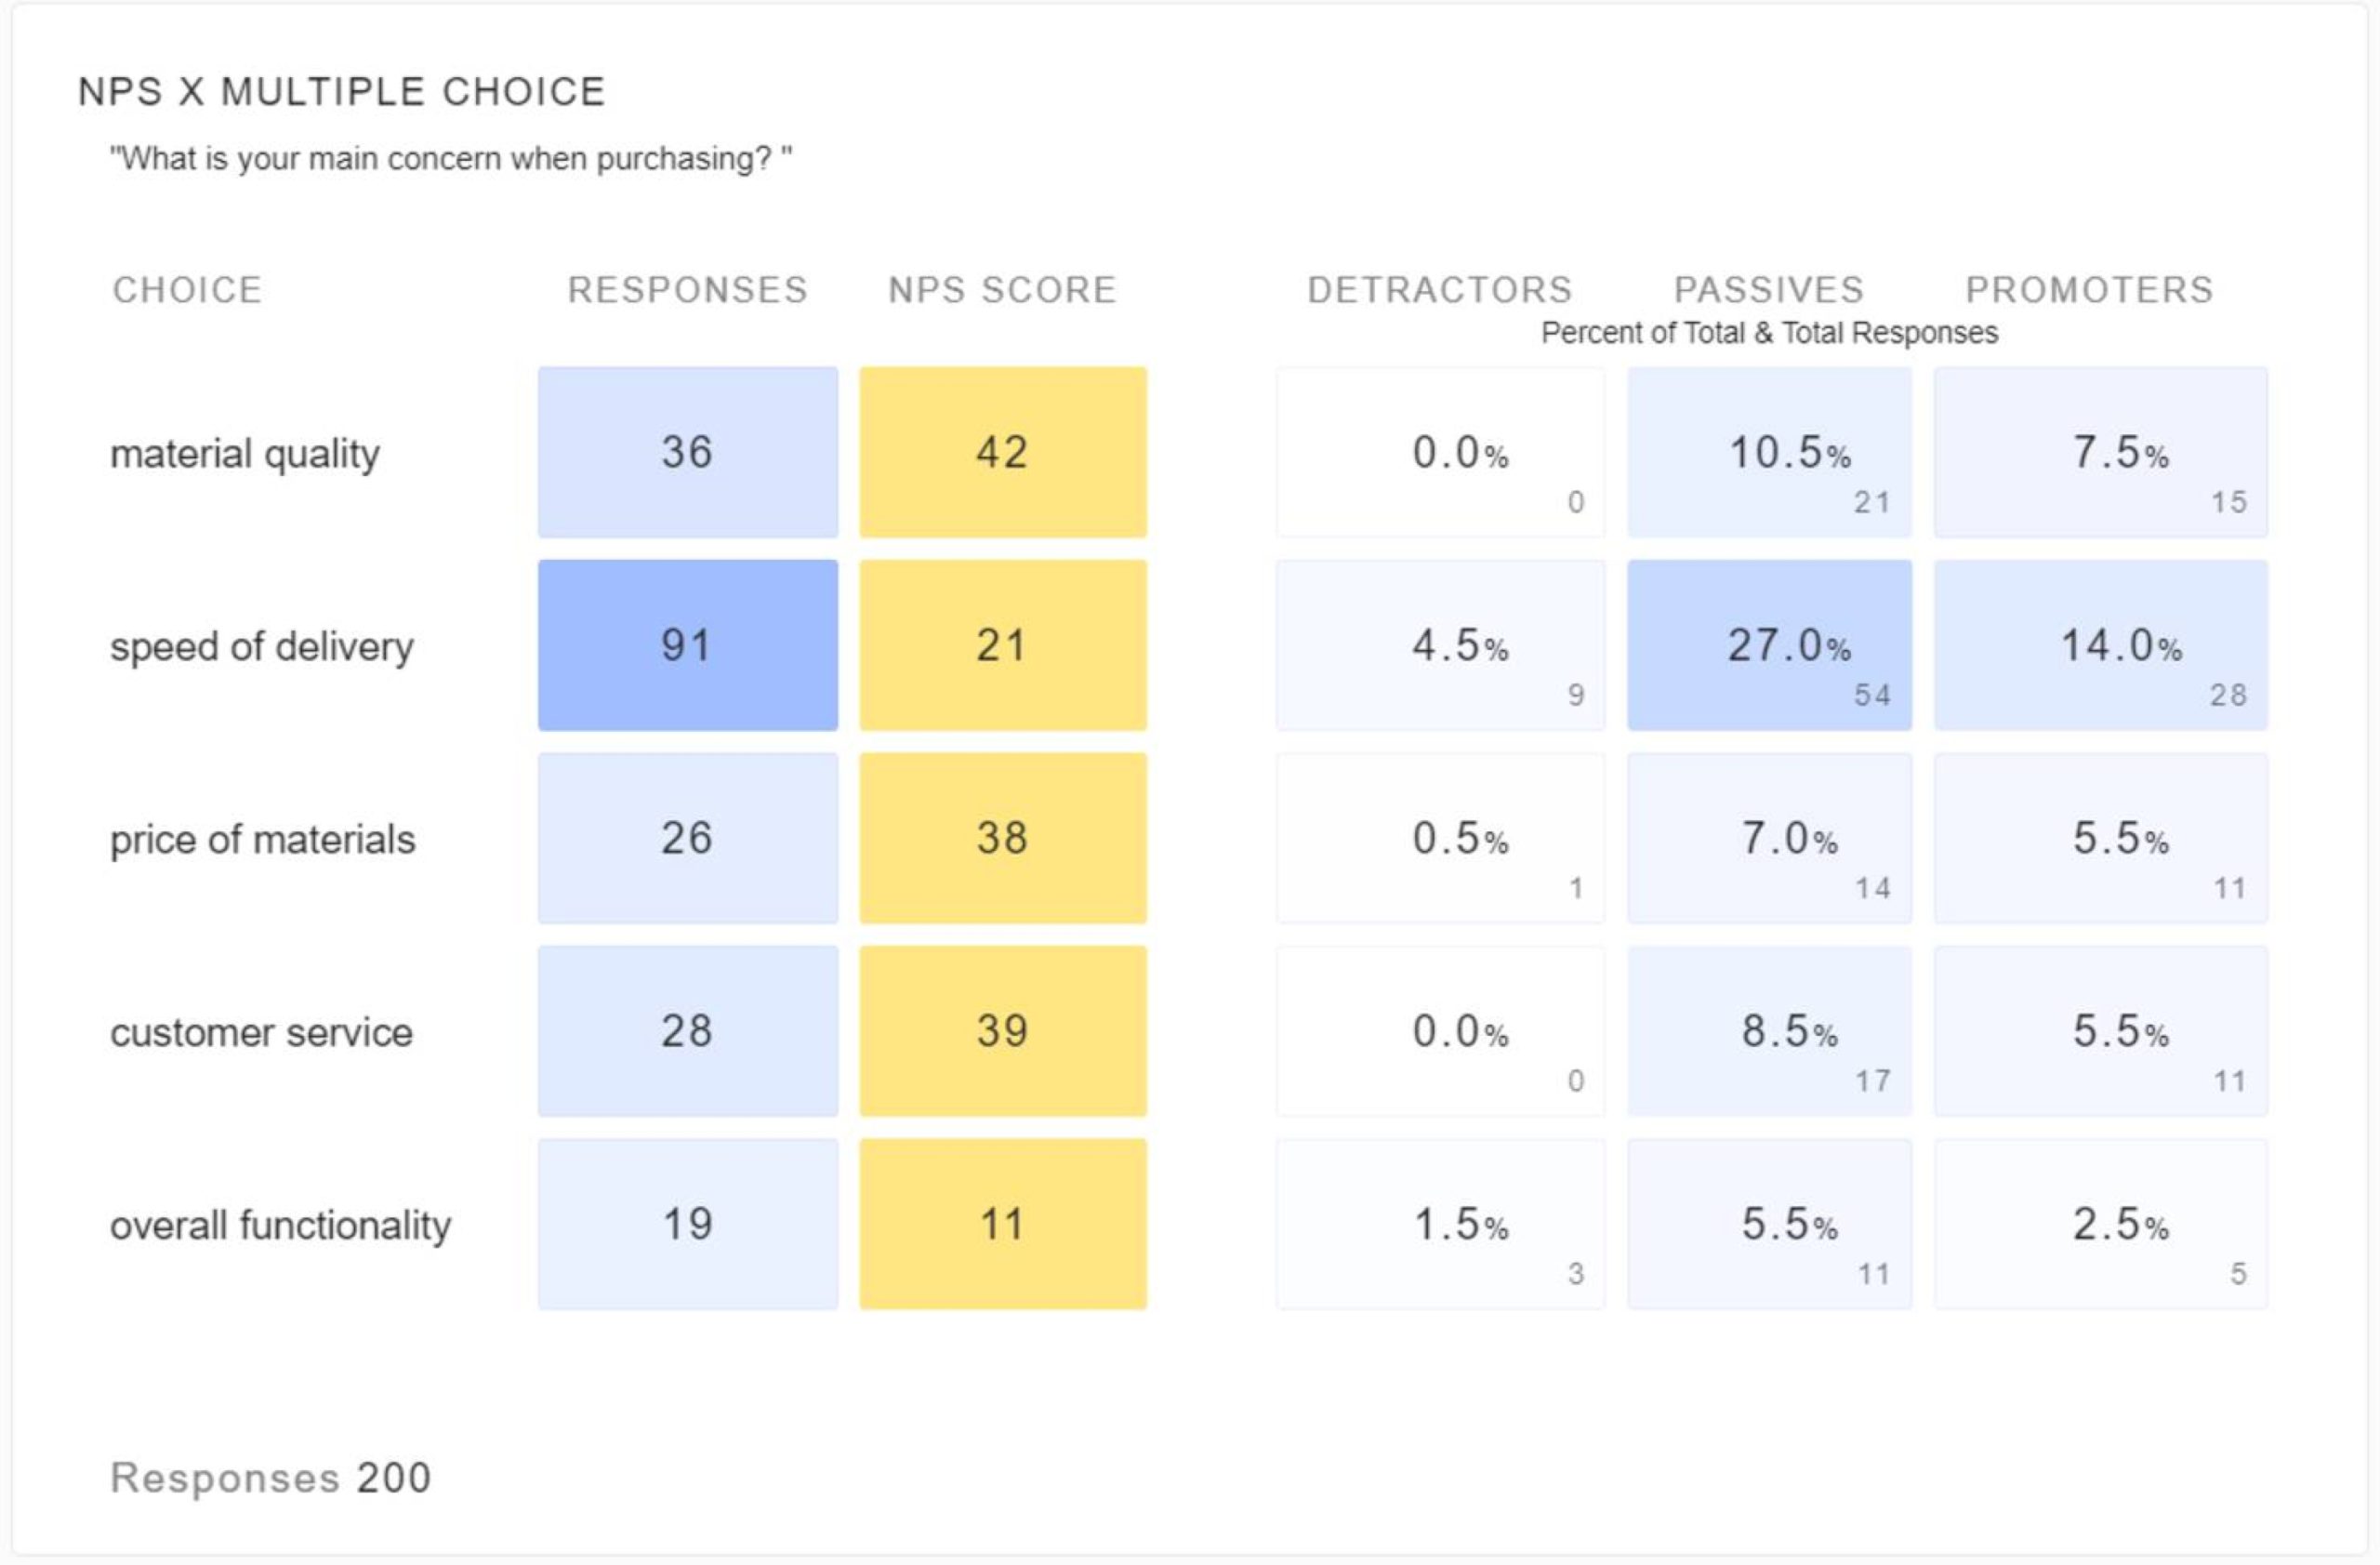
In app.getfeedback.com dashboards, use the NPS Crosstab tile to cross-reference your NPS score with a multiple choice or key driver question and identify which customer experience factors affect your NPS score. You can use this to compare relationships between different data points on the same survey to help you track trends in your survey responses.
Before You Start
- Crosstab analysis works best to analyze an NPS score x key driver question or NPS score x multiple choice question.
- Each key driver requires a separate crosstab tile because the vertical column is an NPS score. We recommend creating separate crosstab tiles for each response option in your multiple choice or key driver question.
Using Crosstab Analysis
- In your app.getfeedback.com dashboard, add or edit a tile for an NPS question.
- Turn on Make Crosstab for your NPS tile.
- Select which multiple choice question you want to use as the filter for your NPS score.
- (Optional) Customize your tile using the settings below:
- Percentages Based On: For each row, show detractors, passives, and promoters as a percentage of each row or total responses.
- Tile name (optional): Add a name and description to help others know what data is included in the tile.
- Date: Choose the date range to show results from.
- Thresholds: Edit the thresholds for colors in your tile. By default, scores 0 and below are shown in red, scores from 1-49 are yellow, and scores 50 and higher are green.
- Filter By: Filter scores in the tile by Merge Field, Answers to certain questions, or Language.
- Select Save to add the tile to the dashboard.