SurveyMonkey
Statistical Significance
Statistical Significance
You can view if there's a statistically significant difference between how certain response groups answered the questions in your survey. To use the statistical significance feature in SurveyMonkey:
- Turn on statistical significance while adding a Compare Rule to a question in your survey. Choose the groups you want to compare to break down your survey results by group in a side-by-side comparison.
- Examine the data tables for the questions in your survey to see if there are statistically significant differences in how different groups answered the survey.
Viewing Statistical Significance
The following steps help you create a survey that can display statistical significance.
- Step 1: Add Closed-Ended Questions to a Survey
- Step 2: Collect Responses
- Step 3: Apply a Compare Rule
- Step 4: Examine Your Data Tables
- Step 5: Share Your Results
Survey Example
You want to see if men are significantly more satisfied with your product than women.
- Add two multiple-choice questions to your survey:
• What is your gender? (Male, Female)
• How satisfied or dissatisfied are you with our product? (Satisfied, Dissatisfied) - Make sure at least 30 respondents select male as their gender AND at least 30 respondents select female as their gender.
- Add a Compare Rule to the question "What is your gender?" and select both the male and female answer options as your groups.
- Use the data table below the question chart for "How satisfied or dissatisfied are you with our product?" to see if any answer options show a statistically significant difference.
What is a statistically significant difference?
A statistically significant difference tells you whether one group's answers are substantially different from another group's answers by using statistical testing. Statistical significance means that the numbers are reliably different, greatly aiding your data analysis. Still, you should also consider whether the results are important — it's up to you to decide how to interpret or take action on your results.
For example, say you receive more customer complaints from women than you do from men. How do you know this is a real difference you should address? One great way is to run a survey to see if your male customers are a lot more satisfied with your product. Using a statistical formula, our statistical significance feature can help you determine if men have significantly higher levels of satisfaction with your product than women. This allows you to take action on data, not on anecdote.
- Statistically Significant Difference
- No Statistically Significant Difference
- Sample Size
Calculating Statistical Significance
We calculate statistical significance using a standard 95% confidence level. When we display an answer option as statistically significant, it means the difference between two groups has less than a 5% probability of occurring by chance or sampling error alone, which is often displayed as p < 0.05.
To calculate the statistical significance between groups, we use the following formulas:
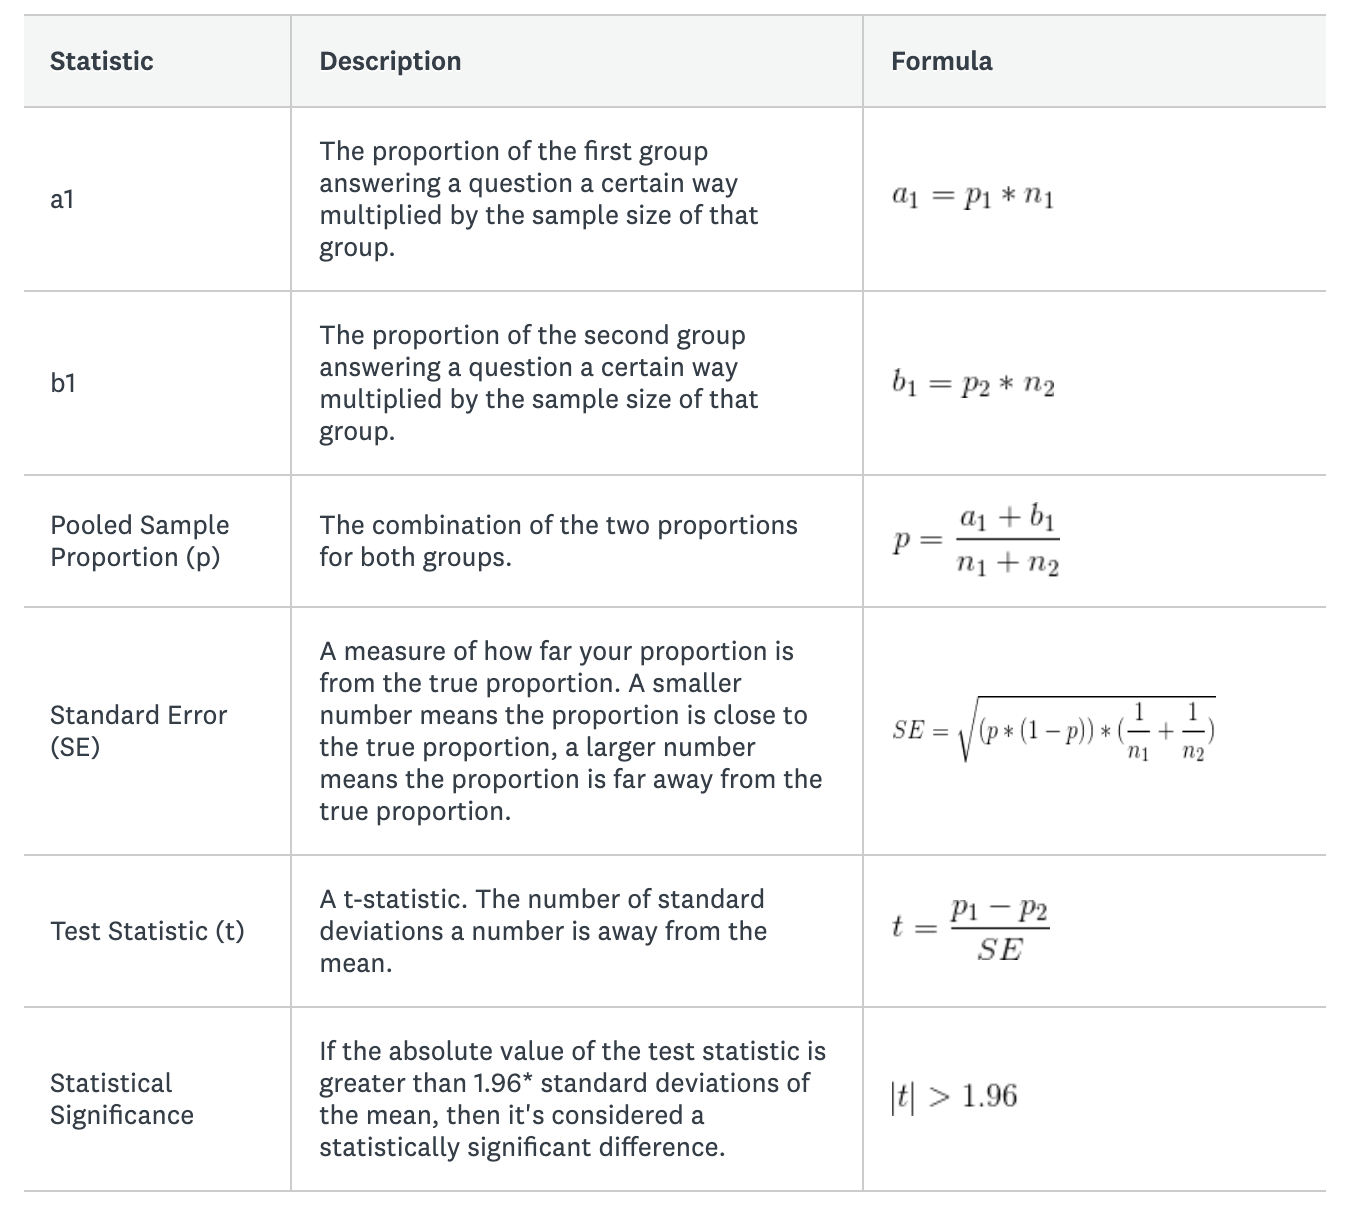
*1.96 is a number used for the 95% confidence level since 95% of the area under a student's t-distribution function lies within 1.96 standard deviations of the mean.
Example Calculation
Continuing the example from above, let's find out if the percent of men who say they are satisfied with your product is significantly more than the percent of women.
Let's say you surveyed 1000 men and 1000 women and found 70% of men say they are satisfied with your product compared to 65% of women. Is 70% significantly higher than 65%?
Use the following survey data to complete the formulas:
- p1 (% of men who are satisfied with the product) = 0.7
- p2 (% of women who are satisfied with the product) = 0.65
- n1 (# of men you surveyed) = 1000
- n2 (# of women you surveyed) = 1000
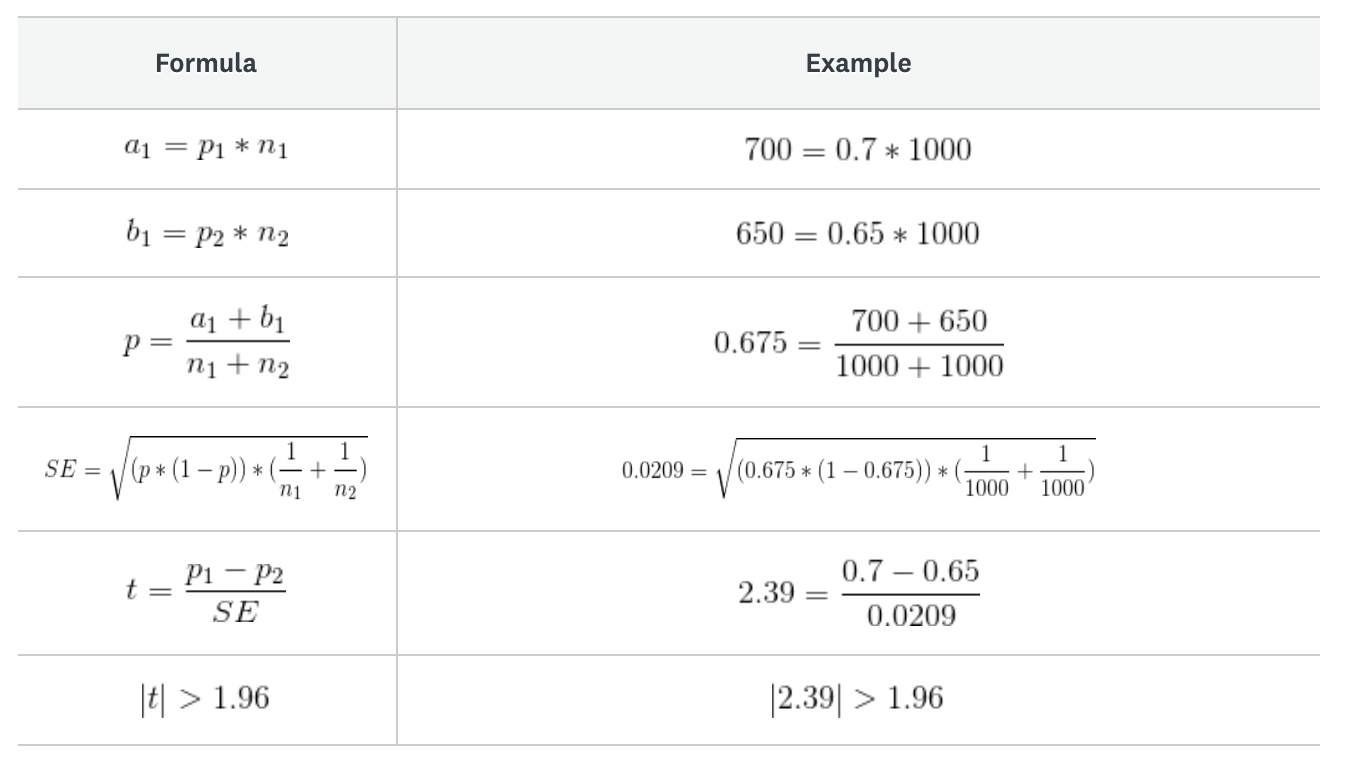
Since the absolute value of the test statistic is greater than 1.96, it means the difference between men and women is significant. Men are more likely to be satisfied with your product than women.
Hiding Statistical Significance
To hide statistical significance for all questions:
- Click the down arrow to the right of the compare rule in the left sidebar.
- Click Edit rule.
- Click the toggle next to Show statistical significance to turn them off.
- Click Apply.
To hide statistical significance for one question:
- Click Customize above the question chart.
- Click the Display Options tab.
- Uncheck the box next to Statistical significance.
- Click Save.
The swap rows and columns display option is automatically turned on when you show statistical significance. If you uncheck this display option, statistical significance is turned off as well.